Banking on Deposits That Can Leave
Why bother
Every ALCO carries a version of the same question: how long should the structural hedge run, and how much should we haircut it for depositors behaving badly? The inputs are usually internal, the haircut is usually a committee number - a figure whose derivation is a meeting - and the run risk is usually a separate document. This post runs the whole chain from public data with every assumption on the table and gets three usable things out.
A number. The SA deposit base licenses roughly 1–7 years of maturity transformation per rand of NMDs. Where you land in that range is a permanence judgement, not a beta estimate, the betas barely move it. A deletion. On SA data the warranted behavioural-runoff haircut on that number is zero. Not small, zero. So the modelling budget the conventional haircut consumes can be reallocated to the run overlay, where the risk actually is. A surface. The transformation-versus-runnability plane turns the Drechsler et al. (2026) (more on DSSW later) run paradox into a picture a committee can point at, with the one genuine unobservable - hidden churn with repricing - priced as a sensitivity rather than ignored.
One plane, two answers
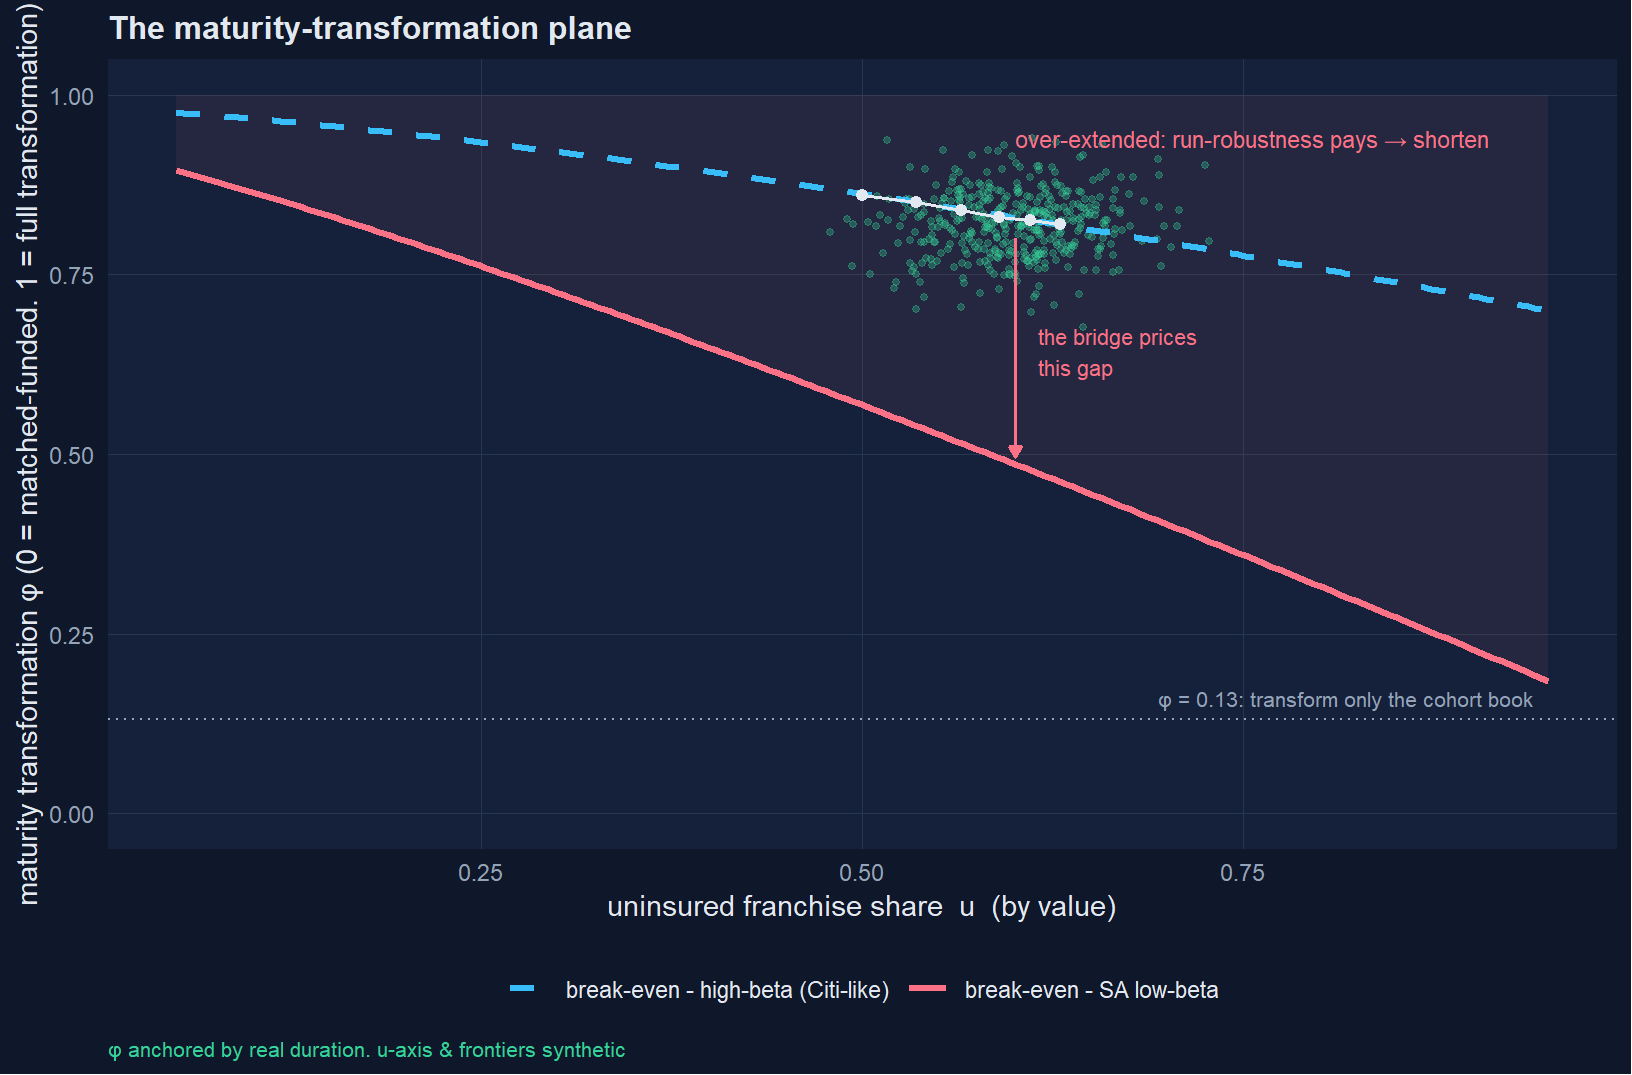
Two coordinates place any bank. Maturity transformation $\phi$ is the share of the franchise-licensed transformation the bank actually runs. At $\phi=1$ the asset book sits a full 7.3 years-per-rand longer than its contractual funding - the transformation the franchise licenses, and the going-concern EVE-neutral point, since the assets’ positive duration and the franchise’s negative duration cancel. At $\phi=0$ the bank is matched-funded: no transformation, fully run-robust, and the franchise’s negative duration left standing alone - institutionally, SA’s mostly prime-linked, floating lending book before any structural hedge. One point on the axis is directly computable: transforming only what the cohort schedule admits sits at $\phi = \mathrm{RD}_{\text{coh}}/\mathrm{RD}_{\text{gc}}$ = 0.95 / 7.26 ≈ 0.13 (both durations computed below). Uninsured share $u$ is the fraction of franchise value (by rand, not by headcount) sitting above the CODI R100k cover - the part that can leave and is not covered in a bank run. The break-even frontier between them is not one line: it depends on the deposit beta, which is a pricing choice, so we draw two. One is SA’s observed low-beta franchise. The other is a high-beta counterfactual we call Citi-like, after the worked contrast in DSSW’s own paper: in March 2023 Citigroup carried an uninsured share comparable to SVB’s, but priced its largely institutional and corporate deposit base at or near market - an effective beta near the top of the US large-bank range - leaving little franchise value per rand at risk of running. Same $u$, opposite book, because beta is a choice.
Where the frontier comes from
The frontier is not decoration; it is the break-even locus of the three ALCO-bridge legs. Moving down the plane (shortening, $\phi\downarrow$) costs term-premium carry (leg 1) and can cost going-concern EVE volatility (leg 2); it buys avoided run-loss (leg 3). The frontier is where they net to zero:
$$ \phi^{*}(u):\quad \text{leg}_3\big(u,\phi^{*}\big) \;=\; \text{leg}_1\big(\phi^{*}\big) + \text{leg}_2\big(\phi^{*}\big) $$($u$ and $\phi$ are the axes; the three legs are the bridge’s components, defined just above and deliberately number-free here - computing them is the next post.)
Two properties of that locus are structural, and they are the only two things the sketch is allowed to assert. First, leg 3 - the run-loss avoided - scales with the runnable franchise, $u \times (1-\beta) \times$ value at risk, while legs 1 and 2 do not depend on $u$ at all; so as $u$ rises, every unit of shortening buys more avoided loss and the break-even $\phi^{*}$ falls: the frontier slopes down. Second, at lower $\beta$ there is more franchise value per rand of uninsured money, so leg 3 is larger at every $u$ and the whole frontier sits lower. The exact level and curvature are the bridge’s job - the curves drawn here are placeholders carrying the right slope and ordering, nothing more.
How to read a point
Reading is then mechanical. Above your beta’s frontier: the run-loss you would avoid by shortening exceeds the carry and EVE-vol you would give up - de-risking pays, and the vertical distance down to the line is the size of the prize (the rose arrow; the bridge converts it to bps of ROE). Below it: carry rules; keep the transformation on. Between the two frontiers: the interesting region - the same balance sheet is over-extended if it prices like an SA bank and fine if it prices like Citi, which is the entire argument for treating $\beta$ as a lever rather than a fact.
The single sentence is in the chart title: at the same uninsured share, low betas and high betas prescribe opposite books. The pairing is DSSW’s, not ours: SVB was uninsured and low-beta - business transaction accounts paying close to nothing, a maximal runnable franchise - which is what exposed it; Citi, at a comparable uninsured share, paid the market and had little franchise to run from. SA’s transaction book resembles the former. ⚠ The $u$-axis and frontiers are still synthetic - they need the public-data build and the bridge.
The thesis
Drechsler et al. (2021) (Banking on Deposits) established that the deposit franchise behaves like a fixed-rate liability: banks raise deposit rates only sluggishly (low beta), so the spread widens with rates and the franchise gains value as rates rise -negative duration that can offset a long fixed-rate asset book, where the bank holds one (the box above takes up SA’s mostly floating case). The sequel (Drechsler et al. (2026)) adds the contingency: the franchise is worth something only while depositors stay, and the runnable ones are the uninsured. Franchise value rises with rates, so a run is most damaging exactly when rates are high. Exposure is the uninsured share times one-minus-beta:
$$ \text{run exposure} \;\propto\; u \,\times\, (1 - \beta) $$Two symbols, both already ours: $u$ is the share of franchise value (by rand, not by headcount) sitting above the CODI R100,000 cover - the money that can leave - and $\beta$ is Post 1’s deposit pass-through. The $(1-\beta)$ weight is where pricing enters: on NGFB’s transactional book (β = 0.463) each rand of uninsured money carries 1 - 0.463 = 0.54 units of runnable-franchise exposure; a Citi-like β = 0.9 would cut that to 0.10 without moving $u$ at all.
CODI cover is R100,000 per depositor per bank - protecting most depositors by count but leaving a large uninsured franchise by value. We keep $u$ on the axis (how ALCO budgets) and draw the $(1-\beta)$ content as two frontiers, because $u$ is structural while $\beta$ is a lever.
The DSSW model in one equation - and where it’s used
DSSW’s franchise model is small enough to carry in your head. Deposits pay $\beta r$; servicing them costs a fixed flow $c$ per rand. If balances never leave and rates sit at $r$ forever, franchise value per rand is a two-leg portfolio:
$$ V_{\infty} \;=\; (1-\beta) \;-\; \frac{\alpha + c}{r} $$(DSSW write the deposit rate as pure $\beta r$; SA deposit rates carry large intercepts, so we haul $\alpha$ into the fixed leg explicitly.) In words: $r$ is the policy rate, $\beta$ the pass-through, $\alpha$ the deposit-rate intercept, $c$ the per-rand servicing cost, and $V_{\infty}$ franchise value per rand of deposits. Substituting the operational book - α = 2.58% and β = 0.463 from Post 1’s pass-through fit, c = 0.25% assumed, r = 6.75% (the last repo in Post 1’s panel): $V_{\infty}$ = (1 − 0.463) − (2.58% + 0.25%) / 6.75% = 0.537 − 0.419 = 0.118
- about 12 cents of perpetual franchise value per rand of cheque-account money. The first leg is floating - $(1-\beta)$ of a floating-rate note, no duration. The second is a short position in a fixed perpetuity paying $\alpha + c$, and it is the entire duration engine:
Beta sets how much the franchise is worth; the fixed leg sets how much it moves. Substituting the real book: the composition-weighted intercept is ᾱ = 4.49% (Post 1 intercepts, canonical NGFB weights), plus c = 0.25%, over r² = 0.0675², so on the real book, NGFB’s blended fixed leg is 4.74% against a 6.75% repo, giving a perpetuity rand duration of -10.4y; the simulator’s -7.26y is the same object truncated at the 240-month horizon. Term is the extreme case: $\alpha \approx 6.9\%$ makes its fixed leg the largest on the book - which, more than its low $\beta$, is why it tops the duration table (-15.7y perpetuity vs -10.0y truncated).
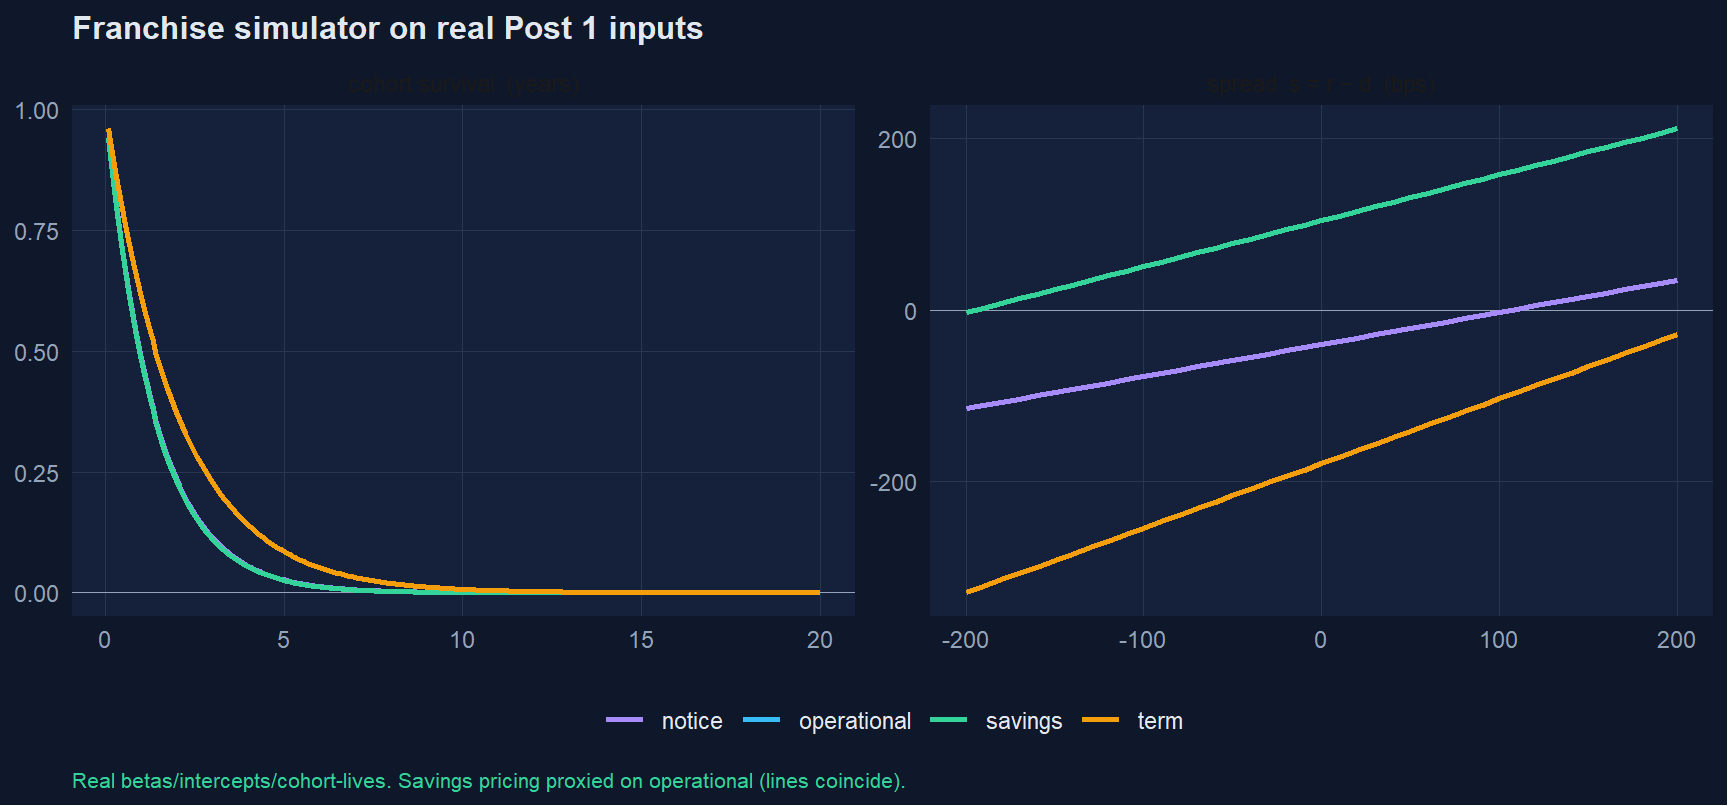
Our simulator is this equation generalised three ways - finite horizon, hazard-decayed balances (so DSSW’s outflow effect has something to act on), and path discounting - and it collapses back to the closed form when the hazard is zero, the path is flat and the horizon runs to infinity. At finite horizon $\beta$ re-enters through the discounting of both legs, which is why we simulate rather than substitute. The closed form is the sanity rail; the simulator is the number.
Where the rest of DSSW shows up:
| DSSW ingredient | status in this post |
|---|---|
| franchise value and fixed-leg duration | implemented and generalised - the engine behind figures 1–2 |
| rate-driven outflows make duration less negative | implemented as $\gamma$; measured ≈ 0 on SA data (figure 3) |
| run exposure $\propto u \times (1-\beta)$; SVB vs Citi | builds the plane’s two frontiers (figure 4) |
| shorten-to-deter-runs vs insolvency-if-rates-fall; capital must cover the uninsured franchise | shapes the bridge legs and decision rules 4–5 |
| the self-fulfilling run equilibrium itself | not implemented - the run stays a scenario on the $u$ axis; pricing the jump is the bridge’s job with Post 4’s buffer, not a derivative’s |
A franchise valuation simulator
Per category $k$, the deposit rate tracks repo with Post 1’s beta and intercept, so the spread loads on rates at slope $(1-\beta_k)$:
$$ d_{k,t} = \alpha_k + \beta_k\, r_t $$$$ s_{k,t} = (1 - \beta_k)\, r_t - \alpha_k $$Reading the subscripts: $k$ indexes the four deposit categories, $t$ the month. $d_{k,t}$ is the rate the bank pays; $\beta_k$ is Post 1’s static pass-through slope; $\alpha_k$ is the intercept, backed out EVE-consistently as the latest deposit rate minus $\beta_k$ times repo; $s_{k,t}$ is what the bank earns over repo before costs; $r_t$ is the repo path. Substituting operational at today’s 6.75% repo: $d$ = 2.58% + 0.463 × 6.75% = 5.71%, so $s$ = 6.75% − 5.71% = 1.04%
- the same R1.04 per R100 as the box above.
Balances decay on a hazard with rate-sensitivity $\gamma_k$, and franchise value is the discounted stream of surviving balances times net spread:
$$ h_{k,t} = h_{k,0}\,\exp\!\big(\gamma_k (s_{k,t} - \bar s_k)\big) $$$$ V_k = \sum\nolimits_{t} D_t\, B_{k,t}\,(s_{k,t} - c_k)\,/\,12 $$The remaining symbols: $h_{k,t}$ is the monthly runoff hazard, whose base level $h_{k,0}$ is zero on the going-concern basis (Post 1’s UC permanence) and one-over-life on the cohort basis - operational’s 16.4-month life gives $h_0$ ≈ 0.061 a month. $\gamma_k$ scales runoff with the spread’s distance from its base-path level $\bar s_k$, and is Post 2’s two-regime prior, not a Post 1 estimate. $B_{k,t}$ is the surviving balance ($B_0 = 1$); $D_t$ the path discount factor $\prod_{u \le t}(1+r_u/12)^{-1}$; $c_k$ the 25bp servicing cost; the division by 12 converts an annual spread to a monthly accrual; and the sum runs to $T$ = 240 months. In coins: the first month’s cash flow on R100 of operational deposits is (1.04% − 0.25%)/12 ≈ 6.6 cents, discounted one month at 6.75%.
The hazard is the smooth, going-concern rate-chasing channel, which we differentiate through. A discrete run is a scenario overlay on the $u$ axis, never a derivative.
Duration, differentiated - and the vanished gap
Franchise rand duration per unit deposit is $-\partial V/\partial\delta$ - the measure US textbooks call dollar duration and the CFA syllabus calls money duration; NGFB banks in rand, so rand duration it is. It is directly comparable to the asset book. (Modified duration divides by the franchise value base, which here is near zero and currently negative - see “what didn’t work” - so rand duration is the honest metric, not a stylistic preference.)
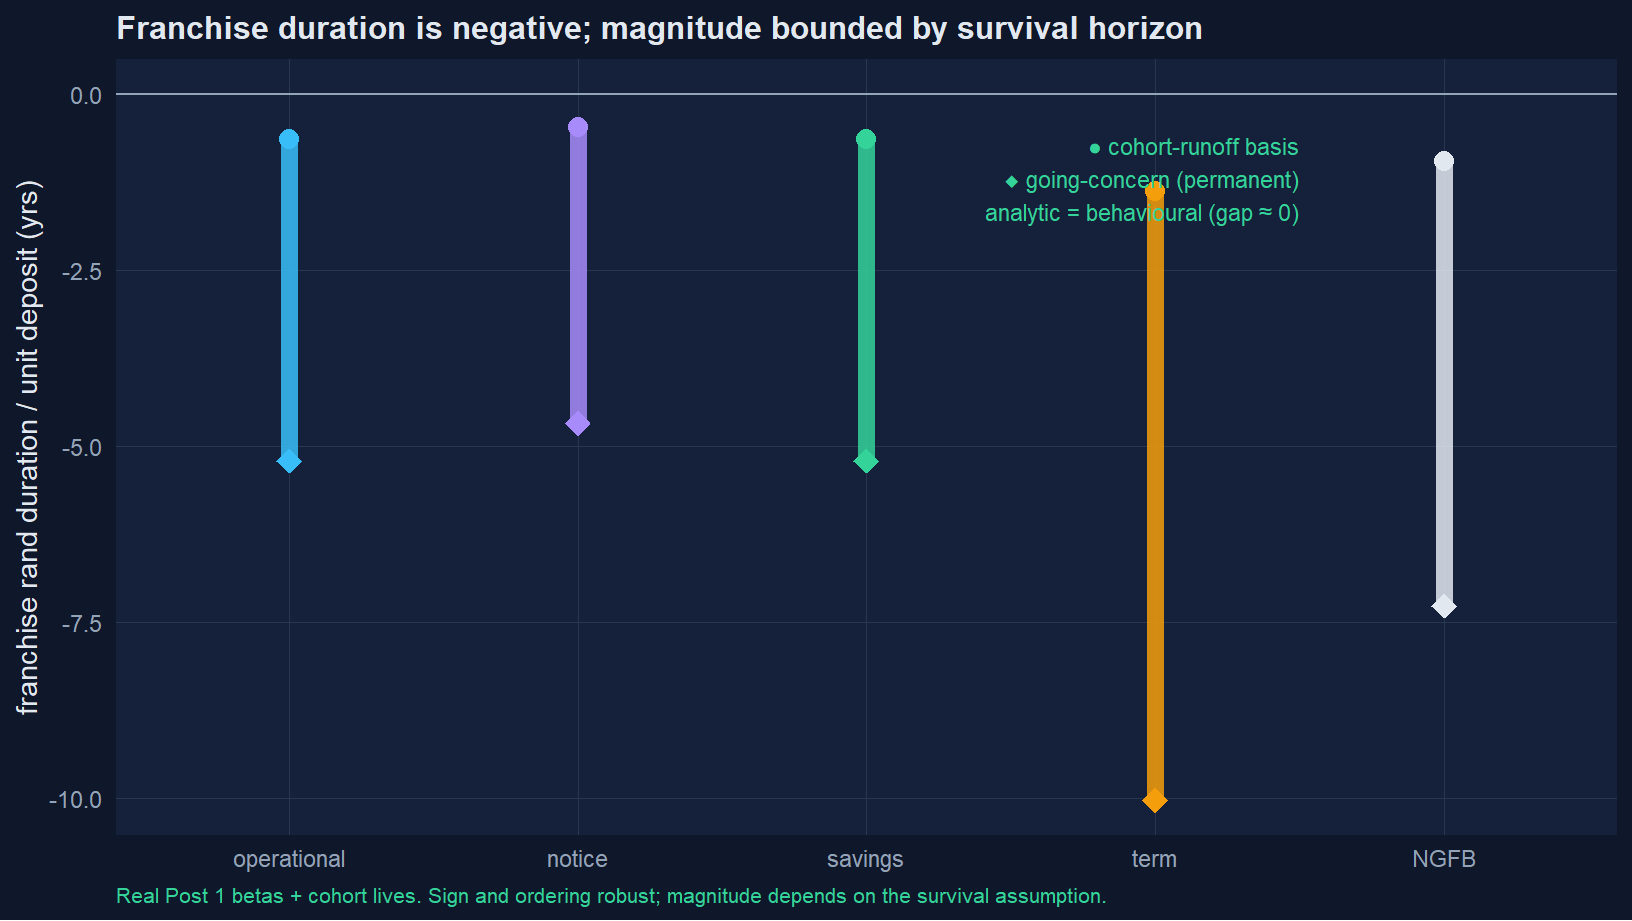
$$ \mathrm{RD}_k = -\,\partial V_k / \partial \delta $$Here $\delta$ is a single parallel shift applied to the entire repo path, and $V_k$ the franchise value above; RD is evaluated at $\delta = 0$ by nudging $\delta$ one basis point either way and Richardson-extrapolating - simulation-differentiated, not autodiff, since it is one directional derivative. The units are years because value-per-unit-rate-per-unit-deposit is dimensionally a time: RD = −7.26y means a +100bp shift adds 7.26% of the deposit base in franchise value. On real inputs the sign and ordering are unambiguous; the magnitude is bounded by the survival horizon.
| category | RD going-concern (yr) | RD cohort (yr) |
|---|---|---|
| operational | -5.20 | -0.64 |
| notice | -4.67 | -0.47 |
| savings | -5.20 | -0.64 |
| term | -10.02 | -1.38 |
| NGFB | -7.26 | -0.95 |
Franchise rand duration, real Post 1 inputs.
Figure 3: Franchise rand duration as a range between the cohort-runoff basis (dots, ~1.5–2y life) and the going-concern basis (diamonds; permanent balances, truncated at the 240-month valuation horizon). Negative throughout; term most negative (largest fixed leg: high α, low β). Analytic = behavioural (gap ≈ 0).
Why the gap is zero, not just small
The gap between analytic duration (frozen decay) and behavioural duration (balances chase rates) was meant to be the finding. Post 1 refuses it. Balances are random-walk-permanent and the competition-flow coupling is null. A permanent balance has almost no baseline runoff for $\gamma$ to accelerate, so cranking $\gamma$ to its external anchor barely moves duration.
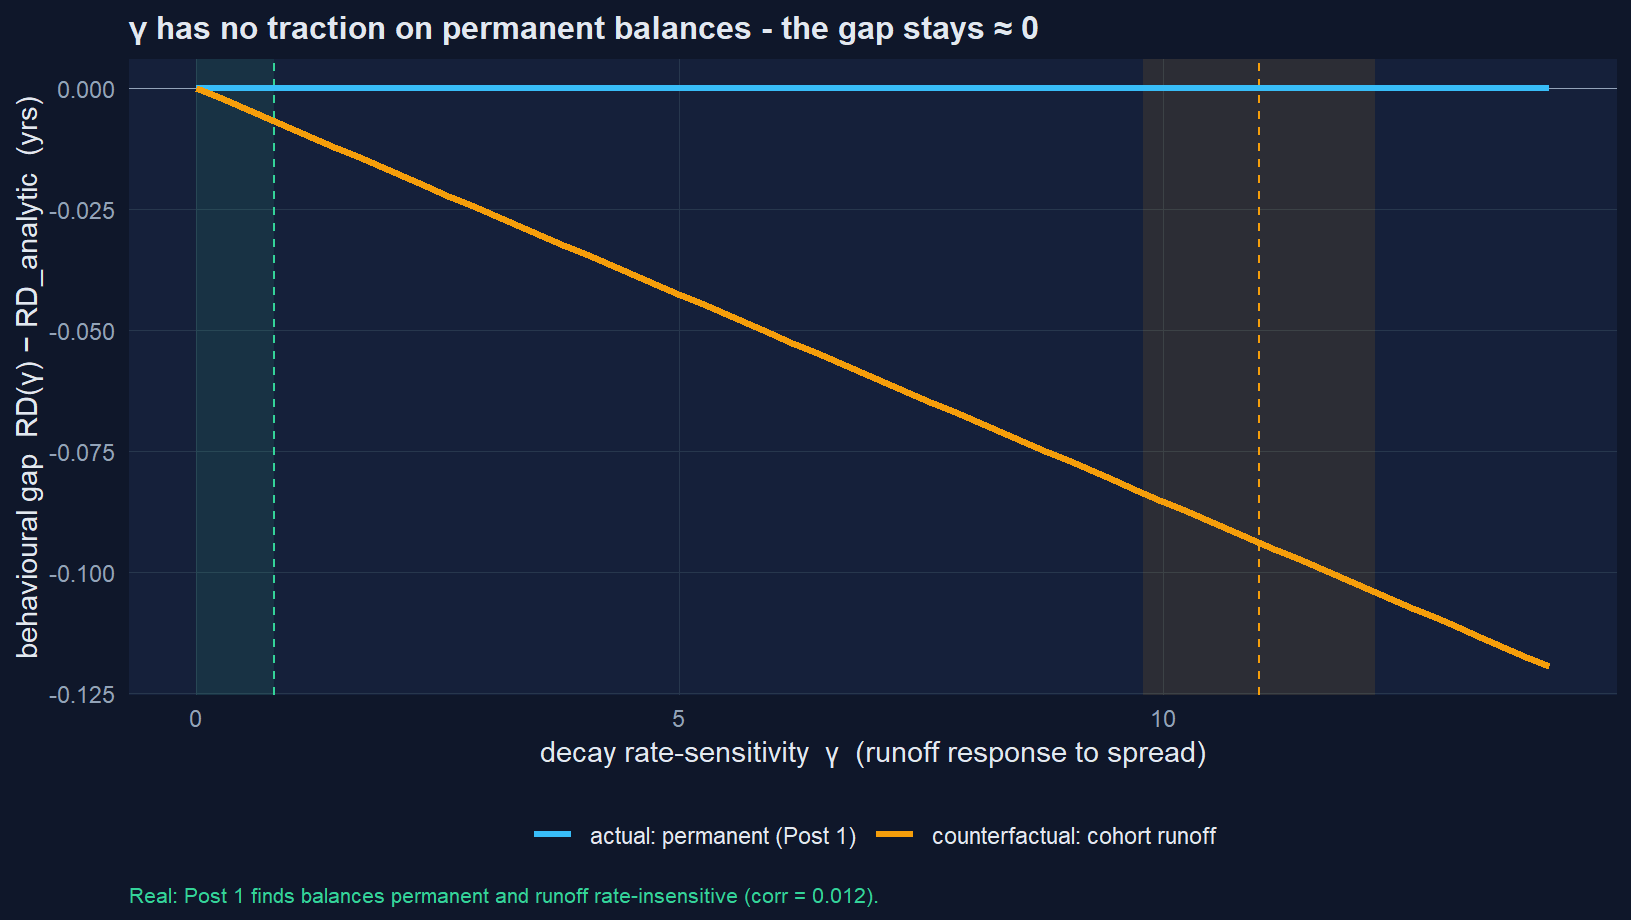
This is not a disappointment - it is the cleanest confirmation of Post 1’s thesis. SA NMD duration lives in pricing, full stop. To be precise about what is doing the work: in the permanent-balance mode the base hazard is zero, so $\gamma \times 0 = 0$ is arithmetic, not a simulation discovery. The load-bearing empirical fact is Post 1’s UC decomposition - transitory balance life of about one month for operational, notice and term - and if you want to dispute the flat cyan line, that is the finding to attack, or take the net-versus-gross route, which the next section does. Savings is the partial exception: its transitory component is persistent (UC φ ≈ 0.97, a ~30-month life), consistent with it being the most rate-aware NMD category; its level is still permanent, so we treat it like the rest and flag the simplification.
Is the zero real, or just the data?
A fair reading of the zero gap: BA900 records net flows. A customer who chases rates out of the book, replaced the same month by a new inflow, is invisible in the aggregate - so $\gamma$ estimated on net data is biased toward zero, and the permanence finding is a statement about the net aggregate, not about customer behaviour. Both halves of that objection are correct. The right response is to be precise about what net data can and cannot certify, and then stress the part it cannot.
What net data can certify: churn replaced at the same pricing schedule is not only invisible - it is value-neutral. The franchise is the spread schedule on the aggregate balance; if a departing rand is replaced by one earning the same $(\alpha,\beta)$, aggregate value and duration are unchanged to the last decimal. Hidden churn only bites if the replacement money is priced differently - the front-book/back-book gap. That reframes the objection into something testable: the risk is not a $\gamma$ feedback the data missed, it is a repricing mix the data cannot see.
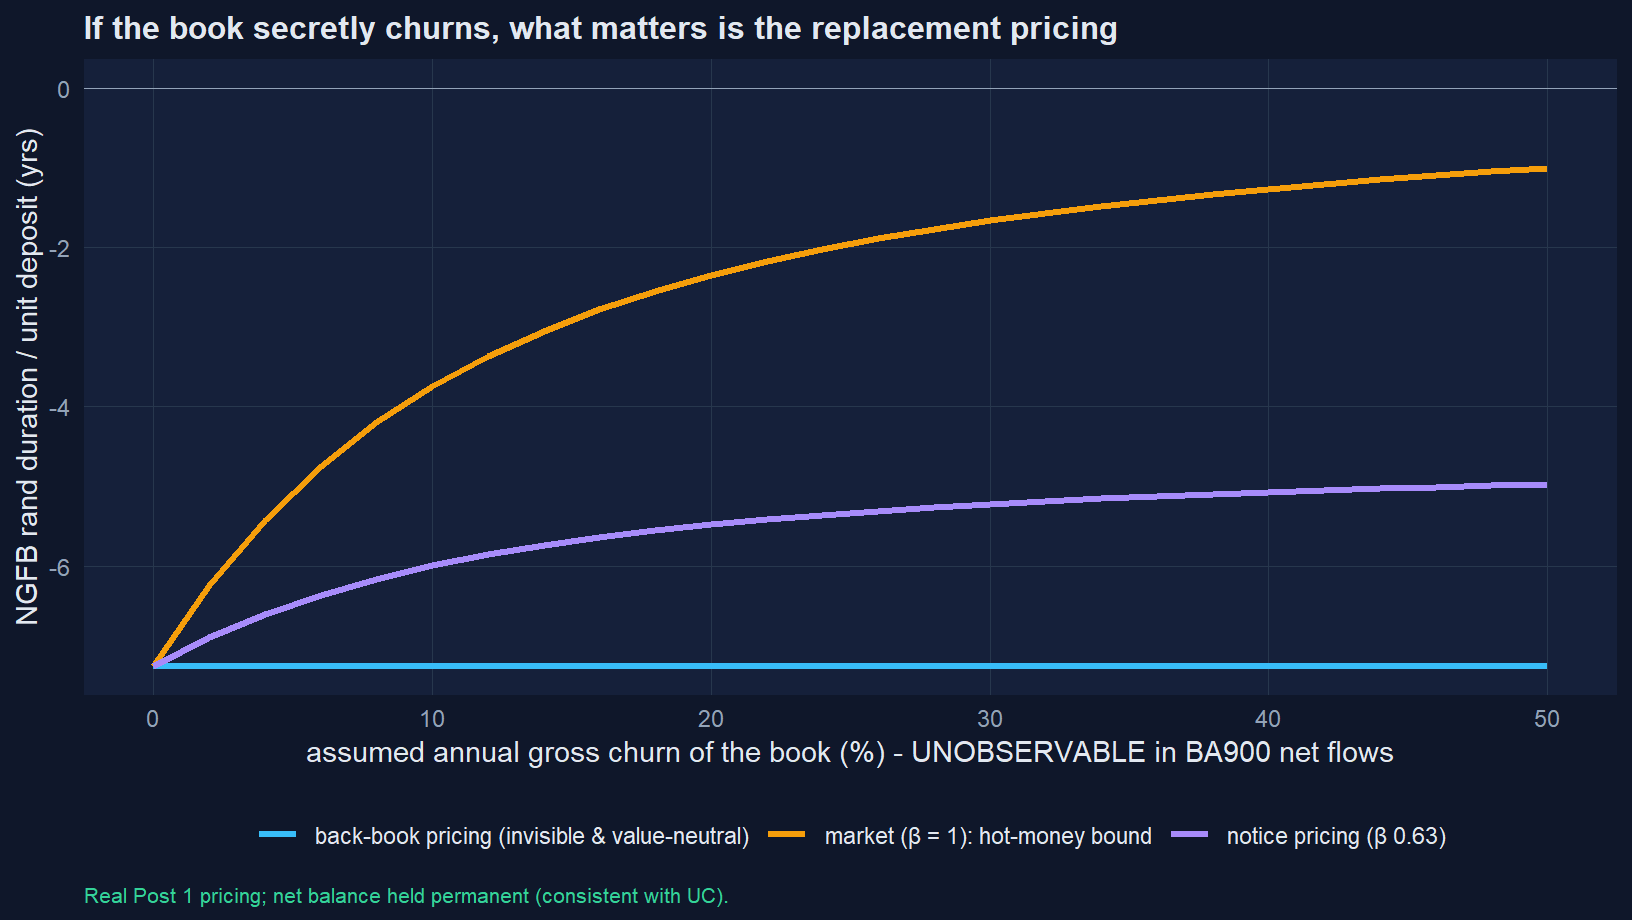
The exhibit holds the net balance permanent - exactly consistent with Post 1 - and churns the composition underneath at an assumed gross rate, under three replacement-pricing assumptions. At back-book pricing the line is flat at -7.3y by construction: invisible and harmless. Replaced at notice pricing the offset erodes gently. Replaced at market ($\beta = 1$, the hot-money bound), 10% annual churn already cuts the franchise duration to -3.7y and 20% to -2.3y. The honest scope of the headline therefore reads: the $\gamma$-feedback gap is zero and robustly so, but the going-concern duration itself is only as strong as the back book’s pricing persistence - and per unit of hidden churn-with-repricing, this figure is the rate of exchange. It is also the same object as the effective-$\beta$ uplift the tail band bounded earlier: churn-to-market and a beta shock are one channel seen from two sides.
What would identify it: customer- or cohort-level gross flow data (internal), or a front-book/back-book rate split where disclosed. Until then the churn rate is a desk prior - the technical term for what the desk believed anyway - and decision rule 1 carries the caveat.
The franchise that pays above repo
The franchise value tells its own story. Operational and savings carry positive repo-spreads, but notice is slightly negative and term is firmly negative - and term is 44% of the book.
| category | beta | weight | spread@6.75% | value/unit | DD_gc (yr) |
|---|---|---|---|---|---|
| operational | 0.463 | 23.9% | +1.04% | 0.087 | -5.2 |
| notice | 0.625 | 8.9% | -0.40% | -0.071 | -4.7 |
| savings | 0.463 | 23.4% | +1.04% | 0.087 | -5.2 |
| term | 0.245 | 43.7% | -1.79% | -0.224 | -10.0 |
| NGFB | NA | 100% | - | -0.063 | -7.3 |
Table 1: Franchise value and duration by category (going-concern basis: permanent balances truncated at 240 months). Savings pricing proxied on operational.
So NGFB’s repo-benchmarked franchise value is currently slightly negative: the 44% term book pays above the policy rate, and the ~25–30bp a maturity-matched benchmark would credit does not close a 179bp gap. Two candidate readings, both probably partly true: SA banks compete hard for retail term funding (an auction where the prize is paying the most), and term money carries regulatory funding value - NSFR available-stable-funding and LCR outflow relief - that the franchise lens deliberately excludes. That value is not lost to the series; it re-enters as the bridge’s run leg, where stable funding is exactly what you are buying. The honest headline stands either way: the valuable, low-beta, DSS-style franchise is the minority transactional-and-savings book, so there is less negative duration doing the offsetting than the −7.3y suggests once you net off the negative-value term book.
The uninsured share, still to come
The plane’s x-axis is the one quantity that genuinely cannot come from Post 1 -
it is a balance-sheet structural fact, not a behavioural parameter. One public
bound already exists: at launch, SARB indicated CODI cover reaches roughly nine
in ten depositors by count but only on the order of a quarter of deposits by
value - implying an all-in uninsured share around three-quarters. The NMD-only
$u$ this plane needs will sit below that once wholesale and corporate balances
are carved out. Build $u$ from CODI covered-deposit disclosures (insured share by
value, to be verified against CODI’s first annual disclosures), the BA900 sector
split on the *TOTAL* denominator, and the LCR stable-versus-wholesale cut.
⚠ Until then this remains the synthetic input.
The aggregation rule, again
NGFB is one truncated posterior-predictive draw across the six banks, bank effects integrated out. Its composition deliberately differs from the industry mix:
| category | NGFB draw | industry |
|---|---|---|
| operational | 23.9% | 46.5% |
| notice | 8.9% | 9.4% |
| savings | 23.4% | 7.8% |
| term | 43.7% | 36.3% |
Table 2: NGFB canonical composition vs industry (the draw is heavier in savings).
Everything on the plane is a cloud, never a league table. The banks know who they are.
Decision rules for ALCO
Findings are only worth their weight in changed decisions. Five rules follow from the results - each tagged robust now if it rides on sign and ordering (which the survival assumption cannot flip) or priced by the bridge if the threshold needs the next post’s numbers.
1. Size the structural hedge off the analytic duration; skip the behavioural haircut. (robust now) The structural hedge can be sized off the analytic franchise duration as-is. The data says there is no going-concern rate-chasing to correct for - padding it for behavioural runoff would be correcting for a channel Post 1 measured as inert. Redirect that modelling budget to the run overlay, where the actual risk lives. One caveat from the churn stress: this licenses skipping the $\gamma$ haircut, not ignoring front-book repricing - if desk data shows gross churn repricing at market, apply it as a $\Delta\beta$ uplift to the analytic duration (the churn exhibit is the exchange rate), not as a behavioural feedback.
2. The transformation notional is a permanence decision, not a beta decision. (robust now) Betas are well-pinned; what moves NGFB’s duration from 1y to 7.3y is how much of the book is treated as permanent. That core/non-core split should be governed explicitly - owned, documented, revisited - not buried inside a model parameter. It is also precisely the dial Post 3’s ladder design will turn.
3. Price every funding-mix change as a rates trade. (robust now) Because term is simultaneously the most expensive funding and the strongest rates-up offset, any shift out of term sells duration. The funding desk and the rates desk are running one book whether they meet or not: a term-book reduction lengthens the bank, and the swap desk inherits a pay-fixed need it did not originate. The vignette below puts rand on this.
4. Buy run-robustness on axes that don’t strip the offset. (priced by the bridge) Shortening the asset book below the going-concern optimum leaves the franchise’s negative duration unoffset on the downside - leg 2 of the bridge is a cost, not a saving. Before paying it, exhaust the levers that move the frontier rather than the bank: price up the runnable uninsured slice specifically (the Citi lever - raising β shrinks the franchise at risk), engineer the insured share under the R100k cap, convert demand balances to contractual notice, and pre-position liquidity (Post 4’s buffer). Blunt duration-shortening is the last resort, not the first.
5. Read your position off the plane, then spend the marginal risk-rand accordingly. (priced by the bridge) Low $u$: run the full transformation; carry rules. High $u$ with SA-typical low betas: you are in the over-extended region - the next rand of risk budget goes to run defences, not more duration. High $u$ with high betas: hold; there is little franchise to run from. The threshold $u^{*}$ where the prescription flips is exactly what the bridge computes.
A worked vignette: move R1bn from 12-month term into 32-day notice
The kind of proposal that reaches ALCO as a pure funding-cost saving. On this post’s numbers it is a three-axis trade:
| axis | effect per R1bn shifted | basis |
|---|---|---|
| carry (NII) | +R13.9m / yr saved | term pays 179bp over repo; notice 40bp |
| rates-up offset (EVE) | −R53.6m of franchise gain per +100bp | GC basis; −R9.1m on cohort basis |
| run lock-in (contractual) | contractual tenor shortens | priced by leg 3 (next post) |
Table 3: Computed from the pipeline’s own spreads and durations, not asserted.
The post does not tell you whether to do the trade; it tells you what it costs on each axis, and the bridge nets them. That is the point of the series: replacing “term is expensive, cut it” with an actual price.
What didn’t work
The behavioural duration gap didn’t just shrink - it vanished. The post was built around a gap between analytic and behavioural franchise duration. On real inputs it is ≈ 0, because permanent balances give the rate-sensitivity nothing to act on. We could manufacture a gap by assuming the book runs off, but Post 1 says it doesn’t. The honest move was to make the gap’s absence the finding. The simulation-differentiation still earns its place - it is how we demonstrated the channel is inert. The fair objection - BA900 is net, so customer-level rate-chasing replaced by inflows is invisible and $\gamma$ is biased toward zero
- gets its own section: churn at unchanged pricing is value-neutral as well as invisible, and churn with repricing is a $\Delta\beta$ story the churn exhibit prices, not a $\gamma$ feedback.
Term deposits break the textbook franchise - negative carry, negative value. The clean “franchise is a valuable negative-duration asset” story assumes below-market deposit rates. SA term deposits, 44% of NGFB, currently pay 179bp above repo - a gap a maturity-matched benchmark (~25–30bp of term premium on this book) nowhere near closes. Their franchise value is negative; only their duration is still negative. We report it rather than benchmark-engineer it away, and note the NSFR/LCR funding value it partly prices.
Savings is a quarter of the book with no price. savings carries no deposit-rate series in the SARB data, so its beta is unidentified - yet it is 23% of the draw. We proxy it on operational; the notice-proxy alternative moves NGFB going-concern duration by about 0.6y. It is the largest single assumption in the post.
Modified franchise duration isn’t just misleading here - it’s broken. Modified duration divides the rate sensitivity by the value base, and NGFB’s franchise value is currently about -0.06 per rand: near zero and negative. The division returns roughly +115 years, with the wrong sign (roughly the age of the Union of South Africa, and about as useful for hedging)
- the metric flips because the denominator wandered through zero, courtesy of the negative-value term book. A risk number that changes sign when a sub-portfolio’s carry does is not a risk number. Rand duration per unit deposit (~1–7y, sign stable) is the quantity an ALCO nets against the asset book.
The ALCO bridge (upcoming posts)
The bridge is scaffolded, not computed. It stacks three legs, all in bps of NII→ROE through the realised path, and inherits Post 4’s net-versus-gross BA900 limitation.
| ALCO bridge leg | expected sign | bps of ROE |
|---|---|---|
| 1. carry given up by shortening below the going-concern optimum | cost (−) | TODO |
| 2. going-concern EVE-vol delta (sign-corrected) | cost (−)* | TODO |
| 3. run-fragility avoided (Post 4 buffer cost saved) | benefit (+) | TODO |
| NET = Leg 3 − Leg 1 − Leg 2 | vs uninsured share u | TODO |
Table 4: Scaffold only. *Leg 2 sign is measured, not assumed. For context, Post 1’s flat-beta EVE mismeasurement was ~29–31 bps of deposit base (~2.8–3.0% CET1) under ±200bp, signed convexity −1.9 bps.
The net is positive when the uninsured-at-risk franchise is large. Computing it needs the bridge calculation, buffer cost, and desk inputs - the next post’s job.
Basel Committee on Banking Supervision. 2016. Interest Rate Risk in the Banking Book. Standards No. d368. Bank for International Settlements. https://www.bis.org/bcbs/publ/d368.htm.
Drechsler, Itamar, Alexi Savov, and Philipp Schnabl. 2021. “Banking on Deposits: Maturity Transformation Without Interest Rate Risk.” The Journal of Finance 76 (3): 1091–143. https://doi.org/10.1111/jofi.13013.
Drechsler, Itamar, Alexi Savov, Philipp Schnabl, and Olivier Wang. 2026. “Deposit Franchise Runs.” The Journal of Finance 81 (3): 1573–617. https://doi.org/10.1111/jofi.70034.